For many businesses, Excel has been the go-to reporting tool for years.
It is familiar, flexible and readily available. But as businesses grow, so does the volume of data they generate. What starts as a simple spreadsheet can quickly become a complicated collection of files, formulas and manual reports spread across multiple departments.
The result?
Many hours spent creating reports, conflicting versions of the truth, and business decisions being made without a clear picture of what is actually happening.
If that sounds familiar, it may be time to consider a different approach.
That’s where Power BI comes in.
what is power bi?
Power BI is a business intelligence and reporting platform developed by Microsoft.
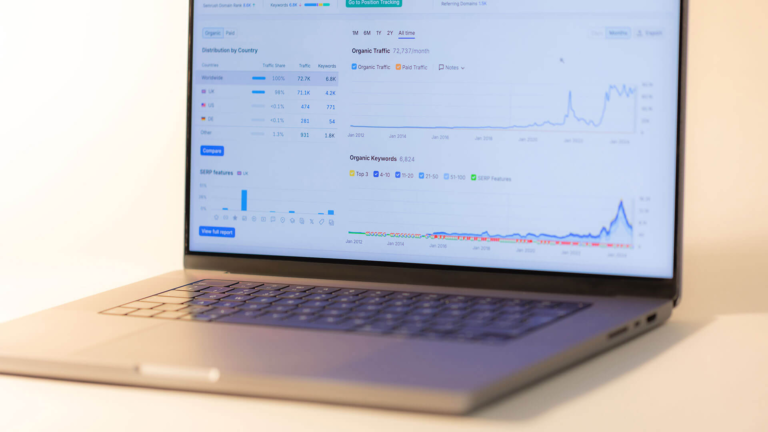
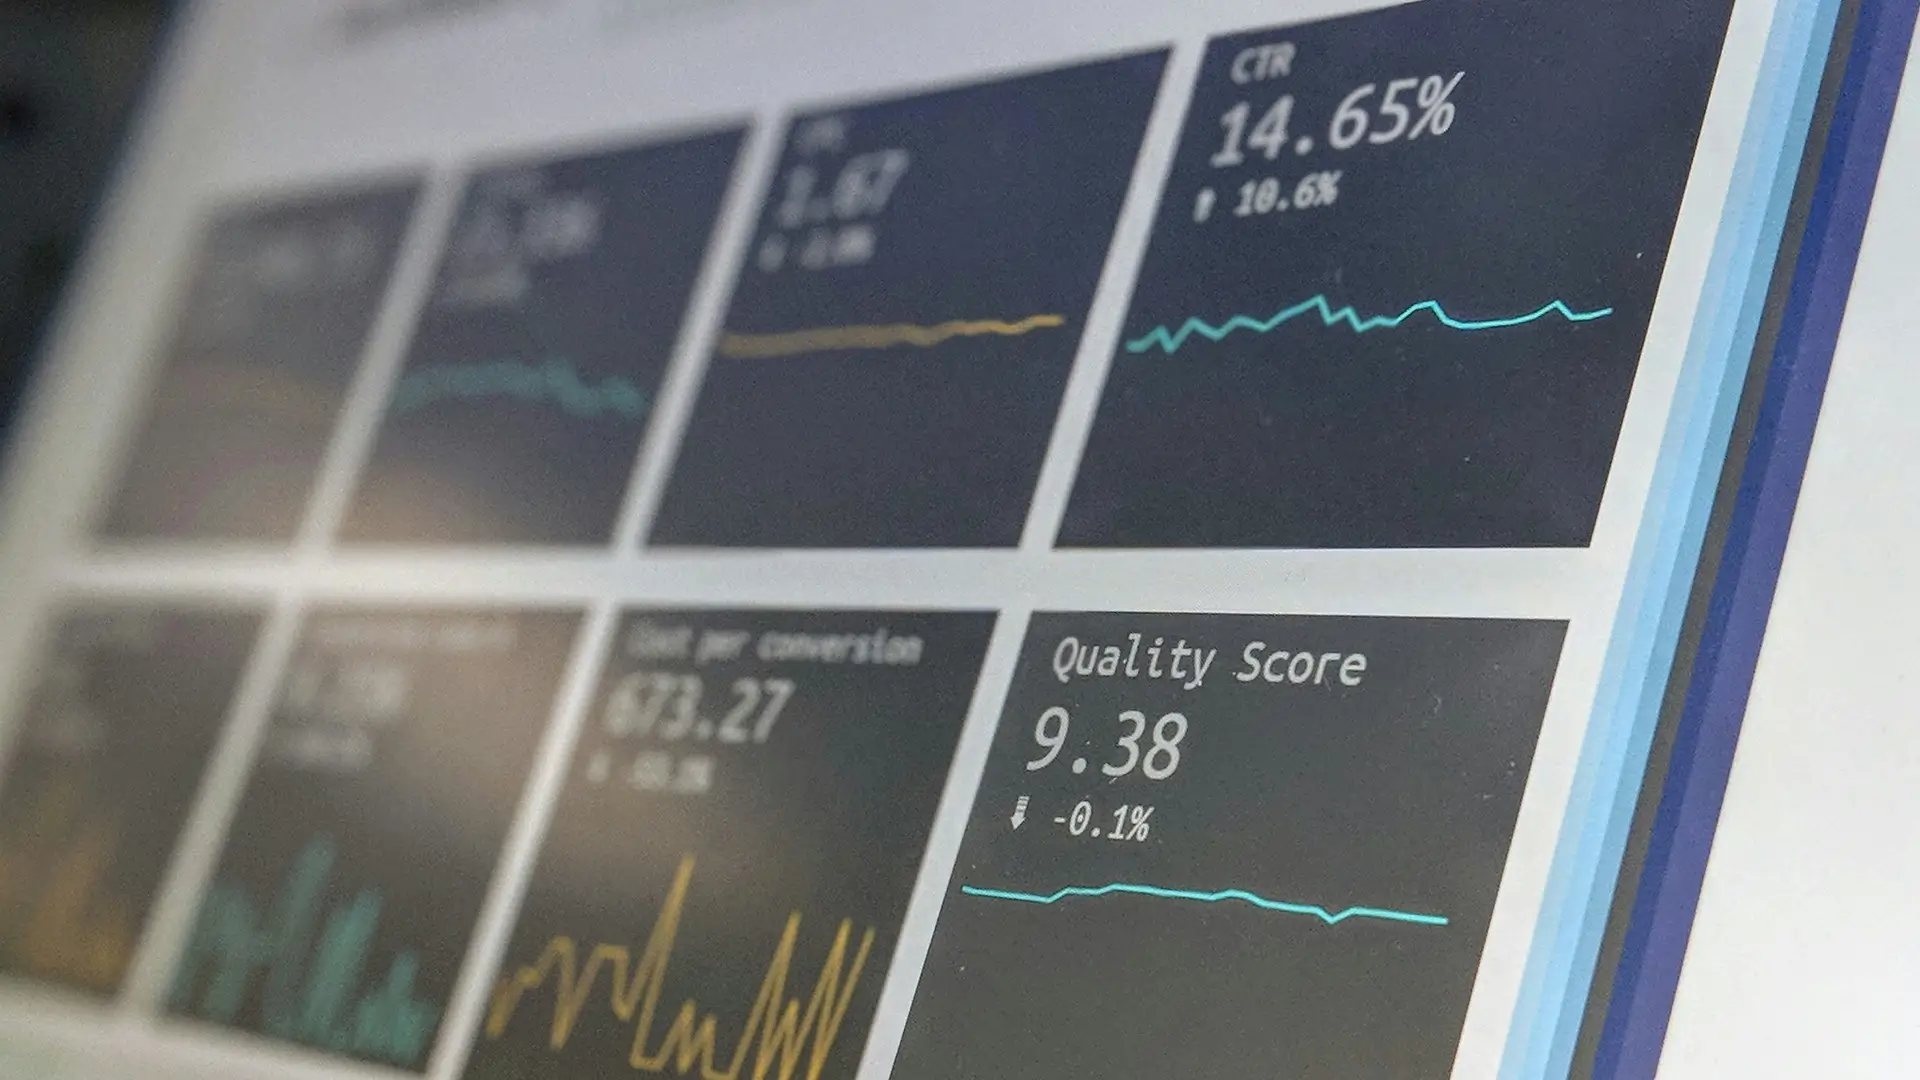
In simple terms, it takes information from the systems and spreadsheets your business already uses and transforms it into interactive dashboards that are easy to understand.
Think of it as a live control centre for your business.
Instead of opening multiple spreadsheets, copying data into reports and creating charts manually, Power BI automatically pulls information together and presents it in one place.
You can view:
- Sales performance
- Marketing results
- Customer behaviour
- Staff attendance
- Project profitability
- Stock levels
- Operational performance
All from a single dashboard.
Even better, the data updates automatically.
Many businesses are already paying for Power BI through their Microsoft 365 subscription but have never opened it or realised its potential.
why are businesses moving away from excel?
Excel remains an incredibly useful tool. The problem isn’t Excel itself. The problem is trying to run an entire reporting system through spreadsheets that were never designed to handle large amounts of connected business data.
As businesses grow, spreadsheets often create more problems than they solve. Here are some common issues we see:
1. Multiple versions of the truth
One person updates a spreadsheet. Someone else saves a copy. Another team makes changes to their version. Before long, nobody is sure which report contains the correct figures. Power BI creates a single source of truth that everyone can access and trust.
2. Manual reporting takes too long
Many businesses still spend hours every week pulling information from different systems and compiling reports manually. If your management team spends just four hours a week producing reports, that’s over 200 hours every year.
Imagine what that time could be used for if reporting happened automatically.
3. Important information gets missed
Spreadsheets are great at storing data. They’re not always great at highlighting trends, anomalies or opportunities. A well-designed dashboard can instantly show:
- Falling sales trends
- Rising costs
- Staff absenteeism issues
- Underperforming products
- Changes in customer behaviour
Often before they become major problems.
who is power bi good for?
One of the biggest misconceptions about business intelligence is that it’s only for large corporations.
In reality, Power BI is often most valuable for small and medium-sized businesses.
recruitment companies
Recruitment agencies generate large volumes of workforce data every day.
Attendance, fulfilment rates, candidate availability, client reporting and staff retention all need monitoring.
Many agencies still manage this information through spreadsheets. A Power BI dashboard can provide a live view of workforce performance and automatically generate client reports.
construction businesses
Construction firms often manage multiple projects simultaneously.
Understanding project profitability, resource allocation, pipeline activity and scheduling can be challenging when information is spread across different systems.
With good business intelligence it helps project managers and directors see exactly what’s happening across every job in real time.
e-commerce businesses
Online retailers and e-commerce businesses generate huge amounts of valuable customer data. Questions such as:
- Which products are most profitable?
- Which marketing channels generate the best customers?
- Where are customers dropping out of the buying journey?
- What is the average order value?
Can all be answered through a properly configured dashboard.
professional services
Consultants, training providers and professional service businesses often struggle to track utilisation, profitability and pipeline performance. Power BI can provide instant visibility into billable hours, client profitability and sales opportunities.
manufacturing and industrial businesses
Manufacturers often need to monitor:
- Production output
- Downtime
- Supplier performance
- Inventory levels
- Asset utilisation
Dashboards provide a clear operational overview that helps improve efficiency and profitability.
5 signs your business isn't making the most of its data
1. reporting takes hours every week
If somebody in your business spends significant time creating reports manually, or maybe it’s you, your reporting process is probably costing more than you realise.
If you hadn’t guessed by now, Power BI automates data collection and visualisation, dramatically reducing administration time.
2. your data lives in multiple places
Most businesses use several systems. Any (or all) of these sound familiar:
- Accounting software
- CRM systems
- Website analytics
- Spreadsheets
- Project management tools
The challenge is the thing you want most, connecting them all together.
Well, you guessed it, Power BI can bring information from multiple sources into a single dashboard, creating a complete picture of business performance. Winning.
3. you only review performance monthly
By the time many reports reach management teams, the information is already weeks old. Modern businesses need visibility in real time. Live dashboards allow leaders to identify opportunities and issues as they happen.
4. you don't know which numbers to trust
If different teams produce different reports and figures, decision-making becomes difficult. Power BI creates consistency by pulling information directly from approved data sources.
5. you're thinking about ai
Artificial intelligence (AI) is everywhere right now. But there is an important truth many businesses overlook…
AI is only as good as the data behind it.
If data is scattered across spreadsheets, duplicated across systems and difficult to access, AI tools become significantly less useful. Good business intelligence is often the first step towards successful AI adoption.
Before AI, comes data visibility.
Before automation, comes data quality.
Before both, comes understanding what your data is actually telling you.
Businesses that implement business intelligence successfully often experience benefits in four key areas:
- Better decision making
- Time savings
- Increased visibility
- Faster growth
Leaders gain more access to timely, accurate information that supports more confident decision making. Automated reporting eliminates repetitive manual tasks and reduces administrative overhead. Business owners can see how the entire organisation is performing at a glance. And when opportunities and problems become visible earlier, businesses can respond faster and improve performance.
how TIG data can help
I know what you’re thinking, why are you telling me this. Well, we’re launching a new service here at TIG where we can help businesses transform their data, into decisions.
Using Power BI, SharePoint, SQL databases and analytics tools, we build dashboards that provide clear visibility into the metrics that matter most.
Whether you’re managing a recruitment agency, construction company, online store or professional services business, or something else, we’ll help you uncover the insights already hidden within your data.
Most businesses already have the information they need to make better decisions…
They simply need a better way to see it.